
What happens behind the scenes of an automated hazard report
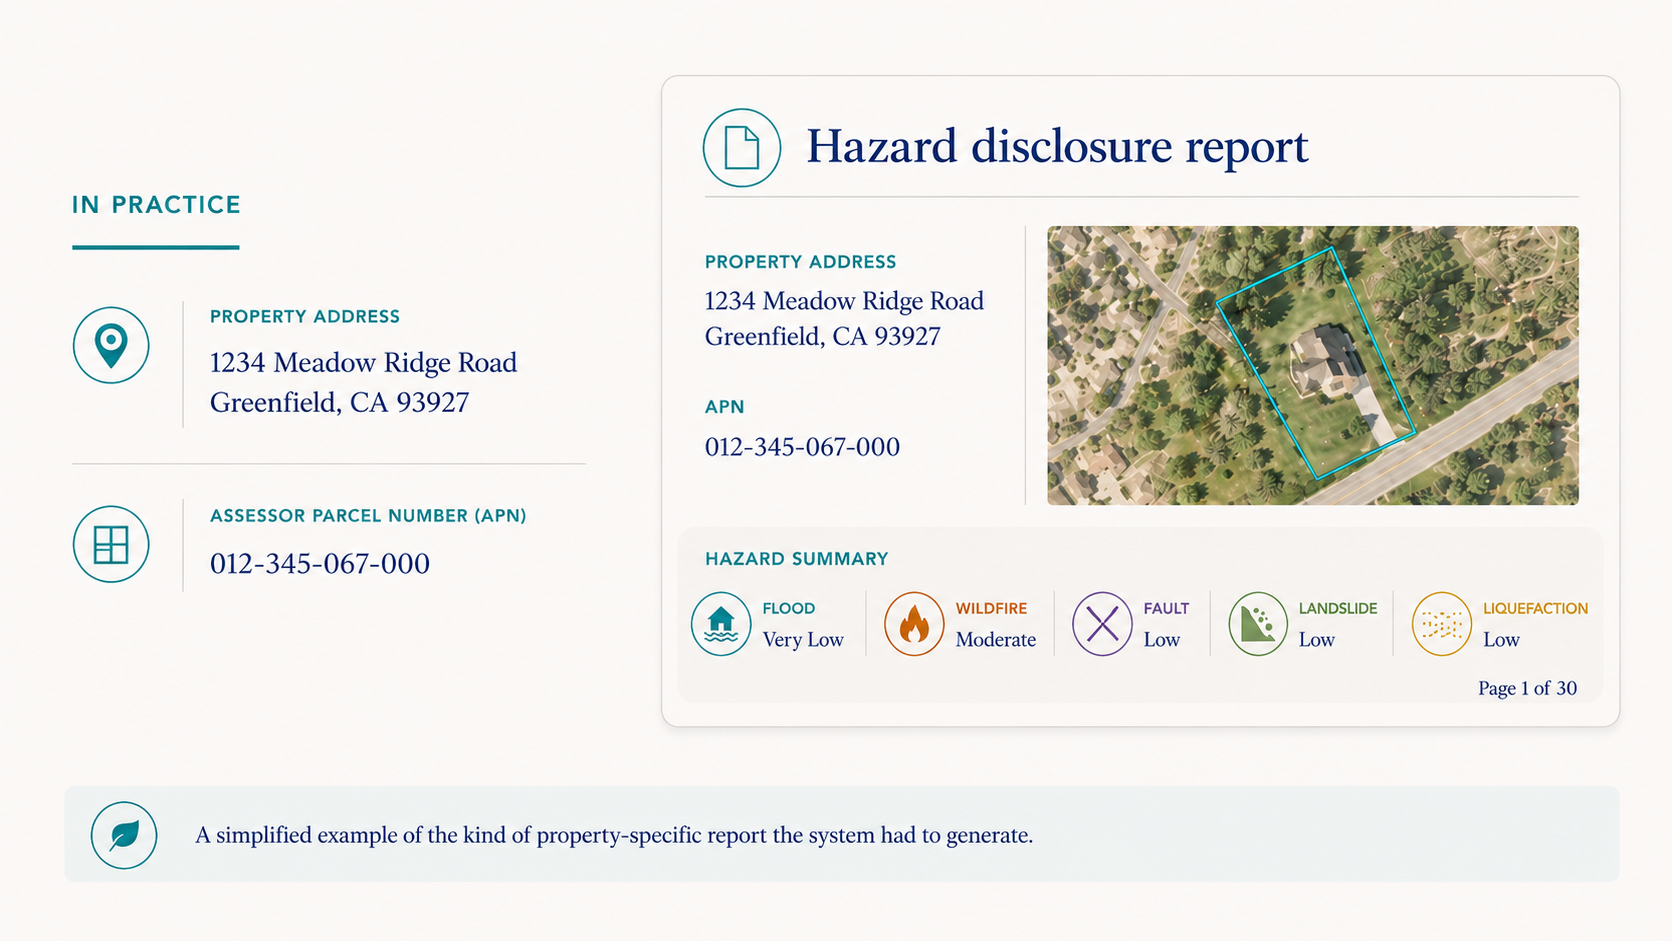
A hazard disclosure report looks simple by the time someone sees it. A property address or parcel number is entered, and a report comes back with maps, tables, disclosure language, property details, checkboxes, and a set of answers tied to a specific place. It tells the reader whether the property falls inside mapped hazard zones, which disclosures may apply, and what information needs to be included in a real estate transaction.
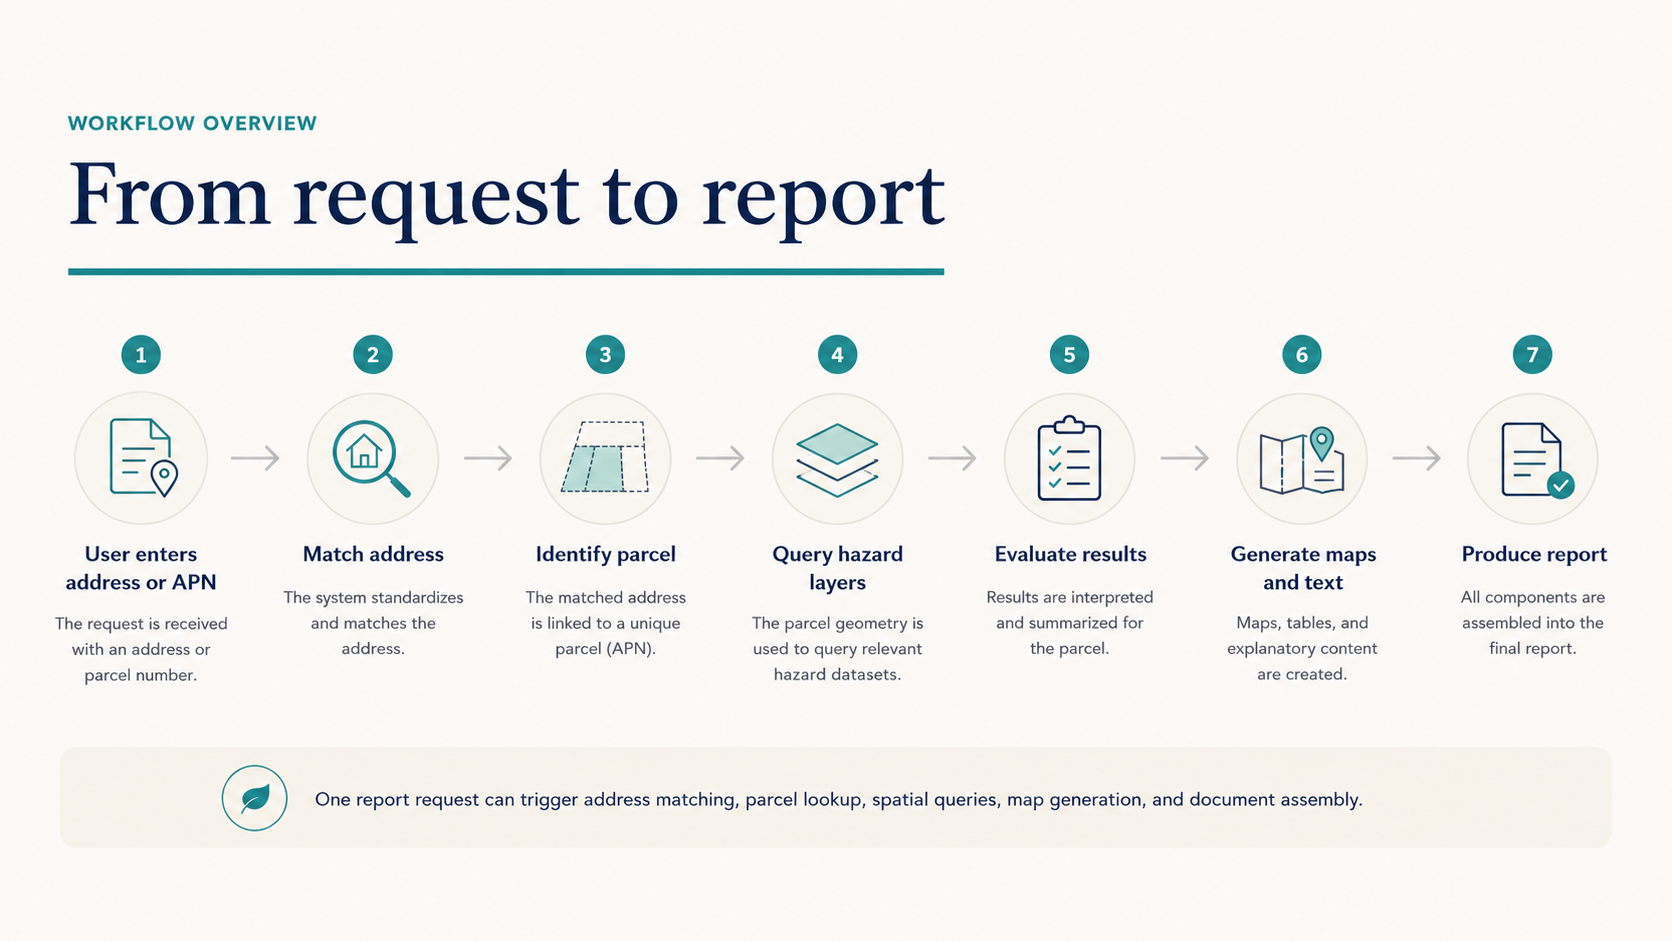
Most of the work happens before the report ever becomes a document. Before a system can say anything useful about hazards, it has to know which property it is evaluating. That means connecting an address to a parcel, finding the right public records, checking the parcel against mapped hazard zones, interpreting the results, and placing the right information into the right parts of the report.
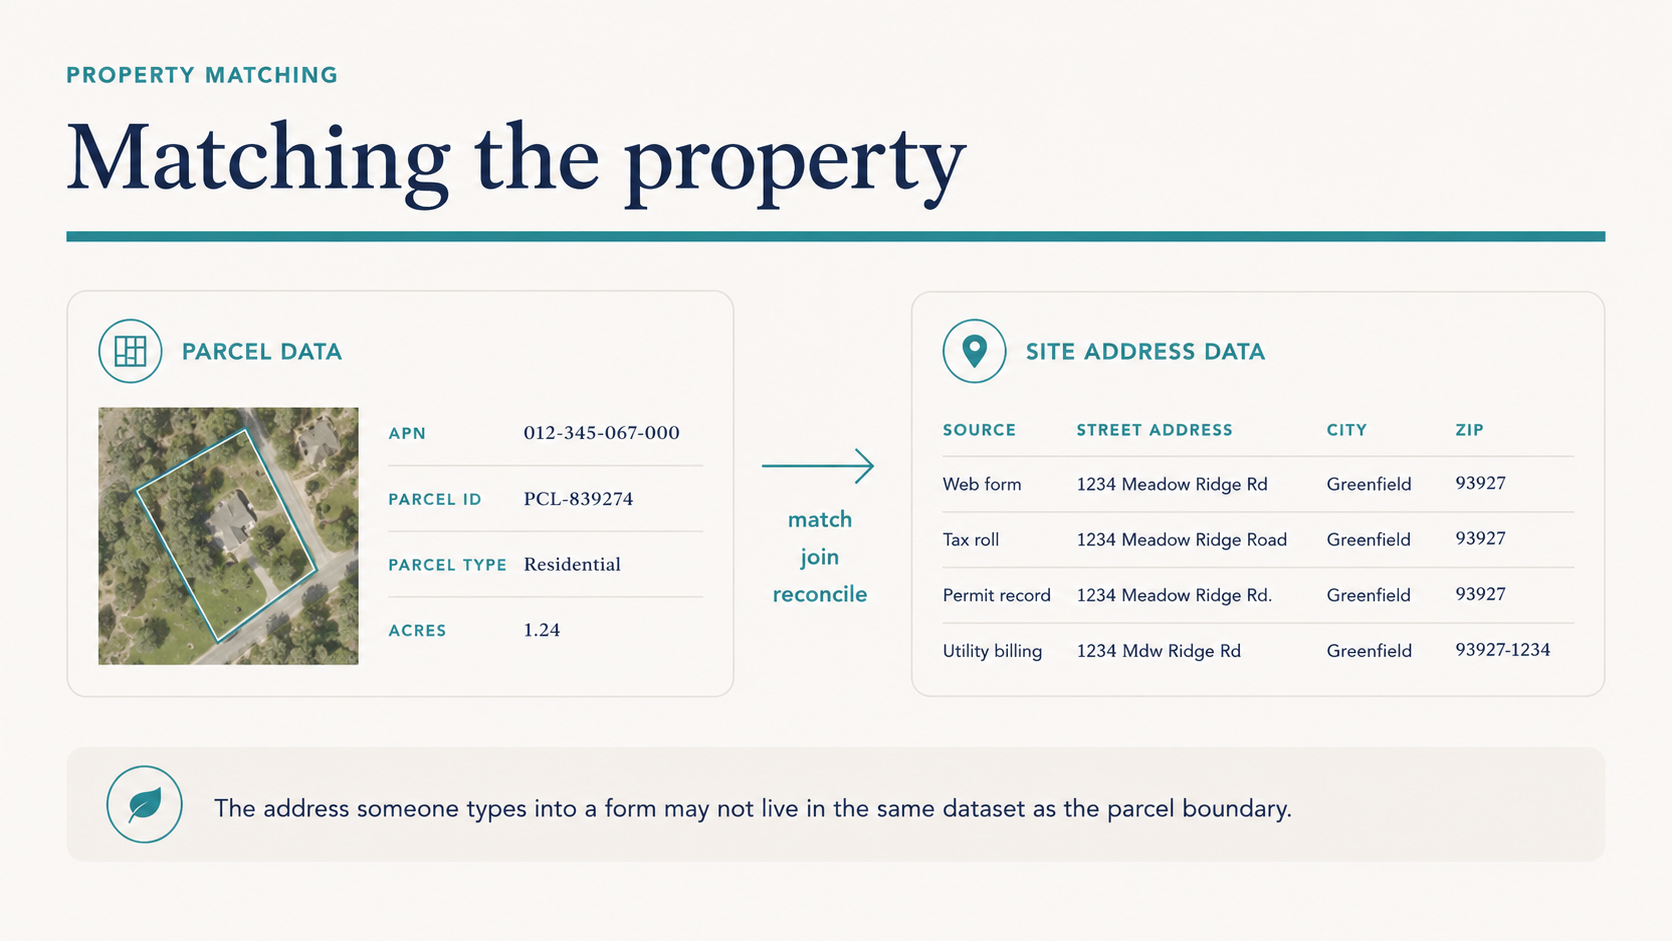
I worked on a project like this for a national company that produced property-related reports for real estate transactions. My work touched the systems behind the report: parcels, site addresses, hazard layers, REST endpoints, Python tools, HTML templates, report logic, and the steady work of turning fragmented public data into something a system could use. The first problem sounds basic: what property are we talking about? But basic does not mean easy. A parcel boundary and a site address are not always stored together. In some jurisdictions, the parcel geometry lives in one GIS layer, the assessor information lives somewhere else, and the site address may be in a separate table, a separate service, or a field that is useful only after it has been cleaned.
The structure changes from place to place. Field names vary. Parcel numbers may be formatted differently from one county to the next. Address fields can be split, abbreviated, misspelled, duplicated, or missing. A county may publish a useful REST service one year and move or change it later. Some places have clean, current GIS data. Others have data that exists, but still needs a person to inspect it before it can support an automated report.
So the first job is not generating the report. The first job is identifying the property correctly. That can mean pulling parcel data from counties across the state, reviewing schemas, standardizing fields, joining site address tables to parcel geometry, checking coordinate systems, and resolving mismatches between what a person types and what the public record contains. It means building a statewide dataset that does not really exist in one finished form.
That is one of the quiet lessons of public data work: availability is not the same as usability. Public agencies may publish parcel layers, site address tables, and hazard maps, but those pieces were not necessarily designed to work together. They may be public without being current, complete, standardized, documented, or ready to be queried by code. Someone still has to find them, inspect them, clean them, link them, and decide how they should behave inside a system.
The hazard data adds another layer. A Natural Hazard Disclosure report has to account for the specific hazards included in the report: flood zones, dam inundation areas, fire hazard zones, state responsibility areas, earthquake fault zones, seismic hazard zones, liquefaction zones, landslide zones, and other disclosure categories tied to the product.
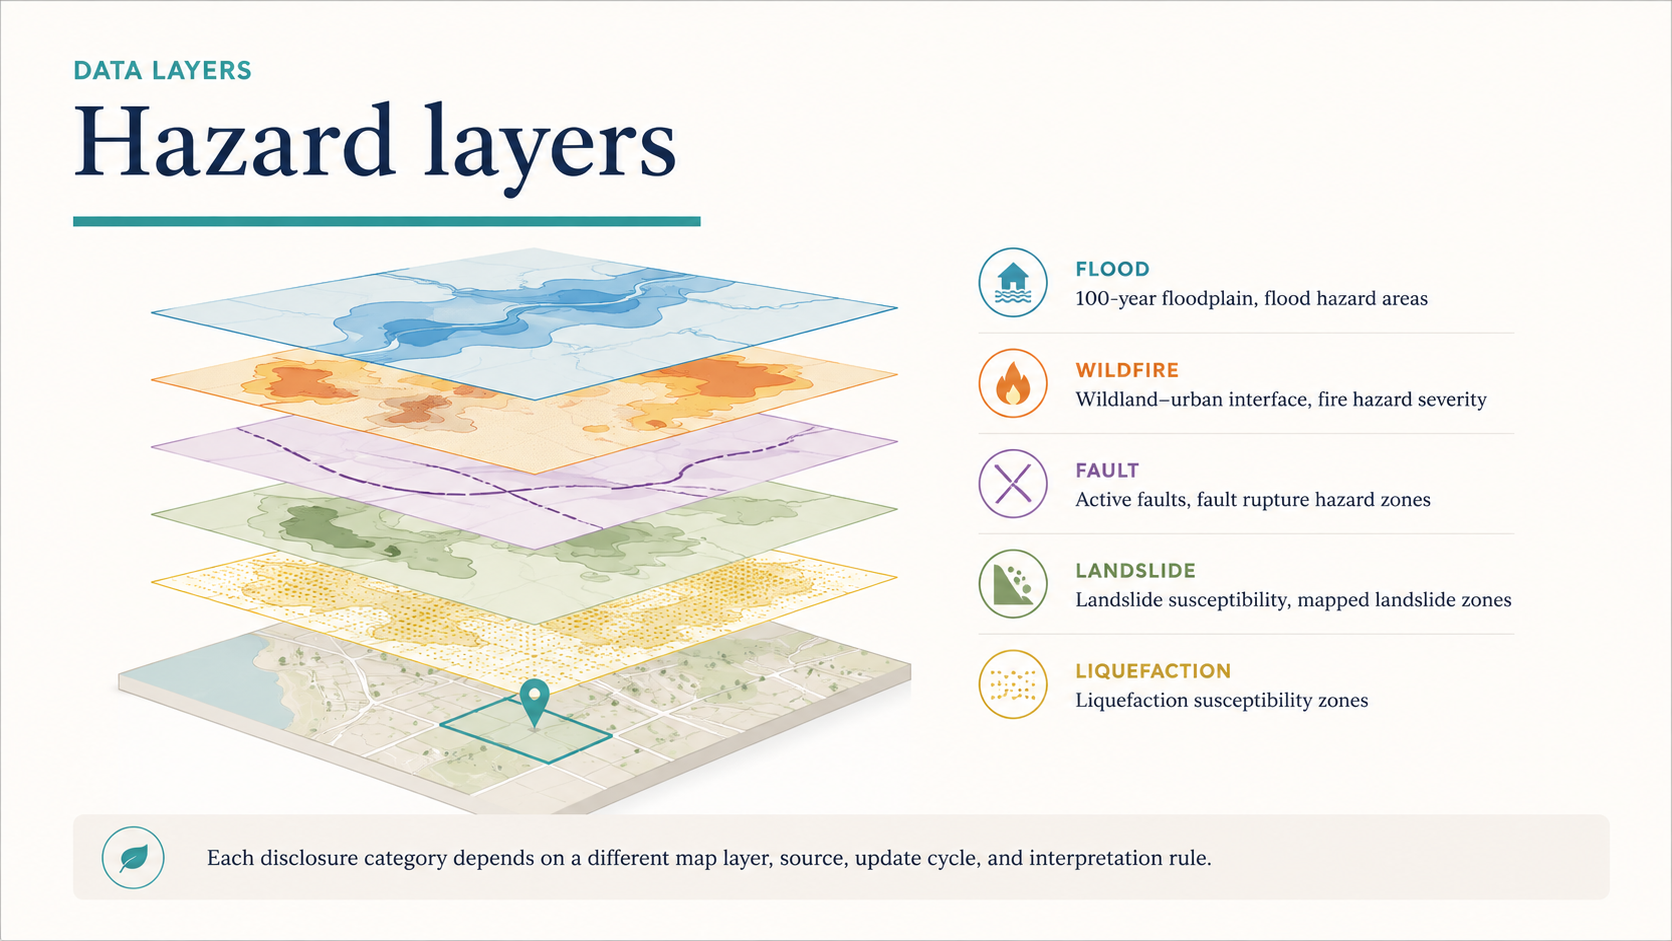
Those layers do not come from one neat source. Some come from federal agencies. Some come from state agencies. Others may come from counties, cities, or special districts. Each source has its own format, update cycle, metadata, geometry, and limits. For an automated system, those differences matter. The system has to know which layer answers which question, whether the parcel intersects a hazard boundary, what to do when a source is unavailable, and how to handle a local layer that uses different language than the report. It has to translate spatial analysis into report language without pretending the source data is cleaner than it is.
REST endpoints and code are practical tools for that work. A REST endpoint gives code a structured way to ask a dataset a question. Instead of opening a map, zooming to a property, clicking layers, and copying results by hand, the system can send a request to a GIS service. It can pass an address, parcel number, geometry, or spatial filter, then receive structured data back.
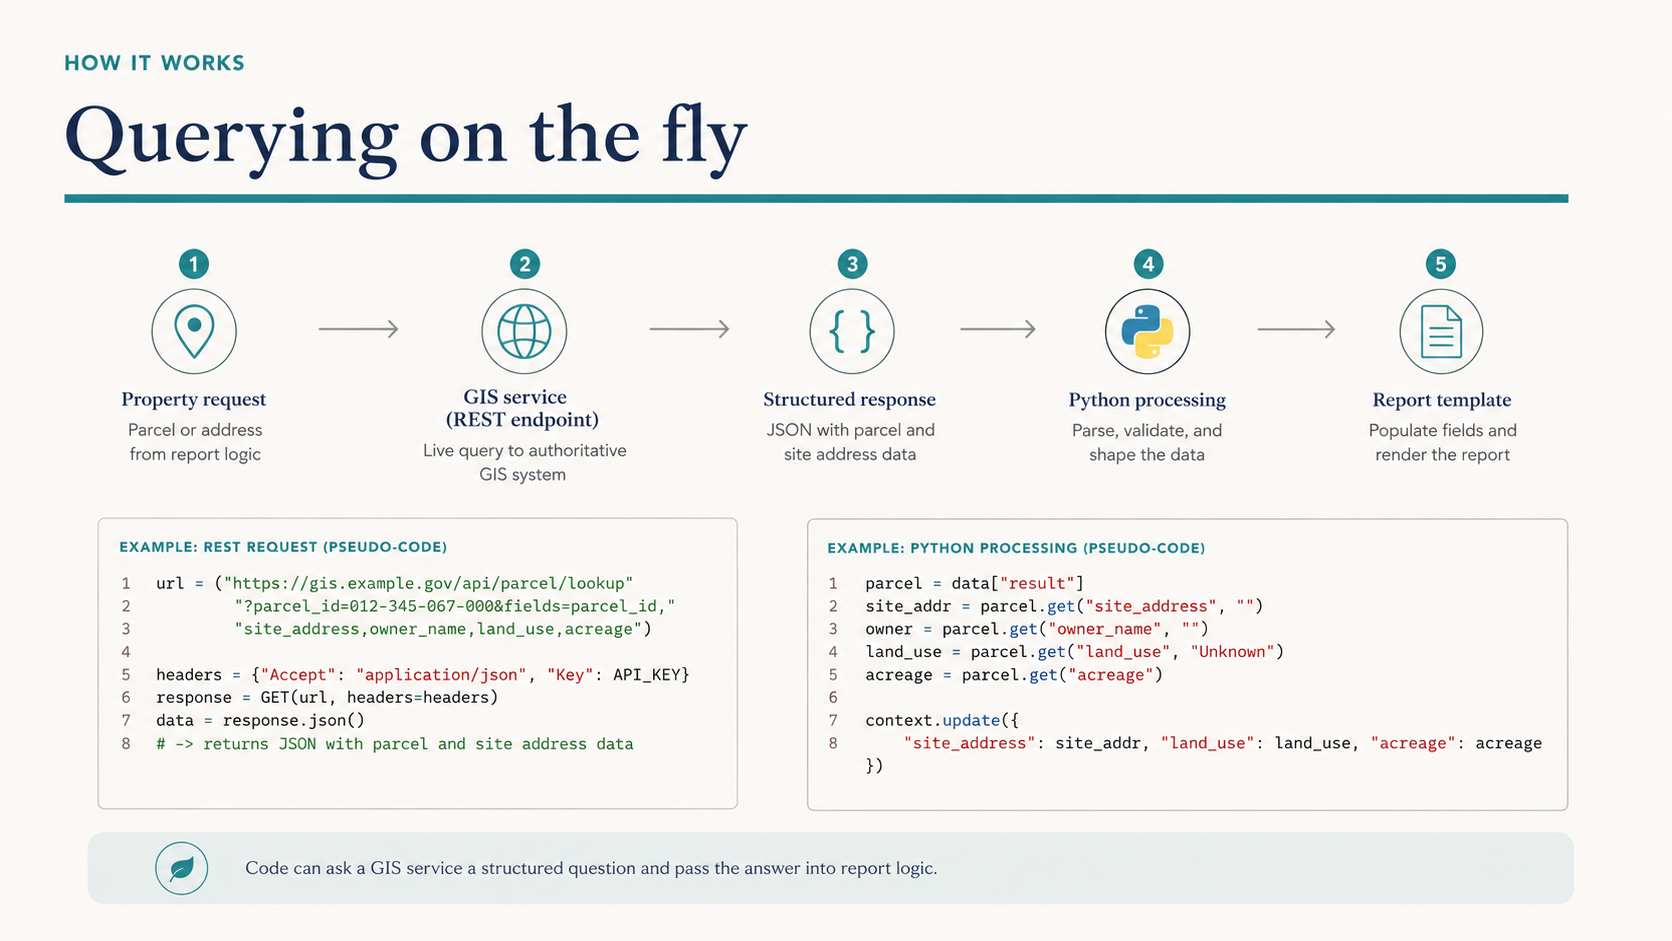
Python can retrieve the data, process it, check spatial relationships, organize results, and pass those results into a report template. HTML and related tools can structure the report before it becomes a final document. A single report request might trigger a whole chain of steps: match the address, identify the parcel, retrieve the parcel geometry, query the hazard layers, check whether the property falls inside mapped zones, generate maps or tables, insert findings into the right places, and produce a property-specific report.
The person ordering the report does not need to see all of that. In fact, the system is working well if they do not have to, but that simplicity is earned. Behind the button are decisions about data sources, field names, joins, spatial logic, update schedules, missing values, report language, and quality checks. Which source is authoritative? Which one is current? What happens when two records disagree? How should the system handle a parcel with no site address? What should be stored locally? What should be queried on the fly?
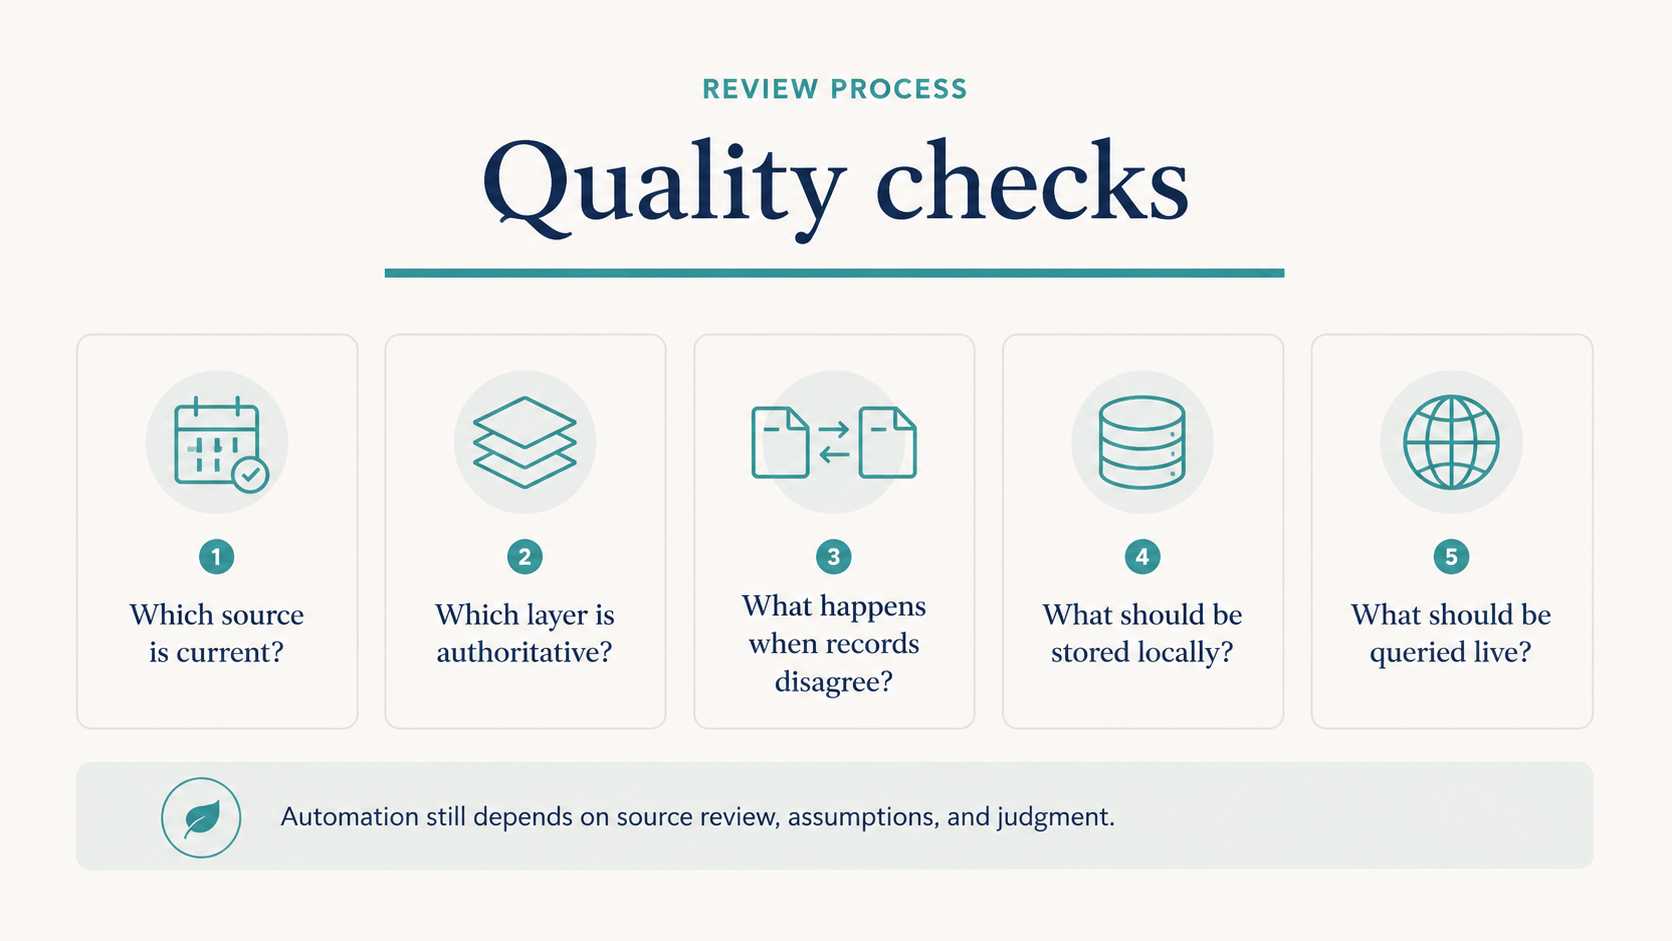
These are not glamorous questions, but they determine whether the report can be trusted. They also show why this kind of work does not sit neatly inside one tool. GIS handles the geography. Python supports querying, cleaning, and automation. REST services connect the system to public data. HTML helps structure the report. Databases hold standardized records. Templates control what the user sees. Documentation keeps track of sources and assumptions. Quality control catches the places where reality does not match the clean version of the workflow.
A hazard report depends on many small pieces being right enough at the same time: the right parcel, the matching address, the correct hazard layers, the right query logic, clear report language, and enough review to catch the places where the data gets messy.
This is the kind of work that sits between public data and public use. The data may come from agencies, maps, records, and legal disclosure requirements, but people encounter it as a report. They need to know what applies to a property. They need the information organized clearly enough to use. They need the system to reduce confusion, not add another layer of it.
That is what I find interesting about this kind of project. The technical work matters because the administrative world is messy. Public records are scattered. Jurisdictions structure information differently. Maps carry assumptions. Forms require specific answers. People still need to make decisions.
Building an automated hazard disclosure system is the work of turning scattered public information into a usable system, one property at a time.
Visual note: All images in this piece are AI-generated illustrative examples. They are intended to explain the general nature of the work and do not disclose, reproduce, or represent proprietary materials from any former employer or client.